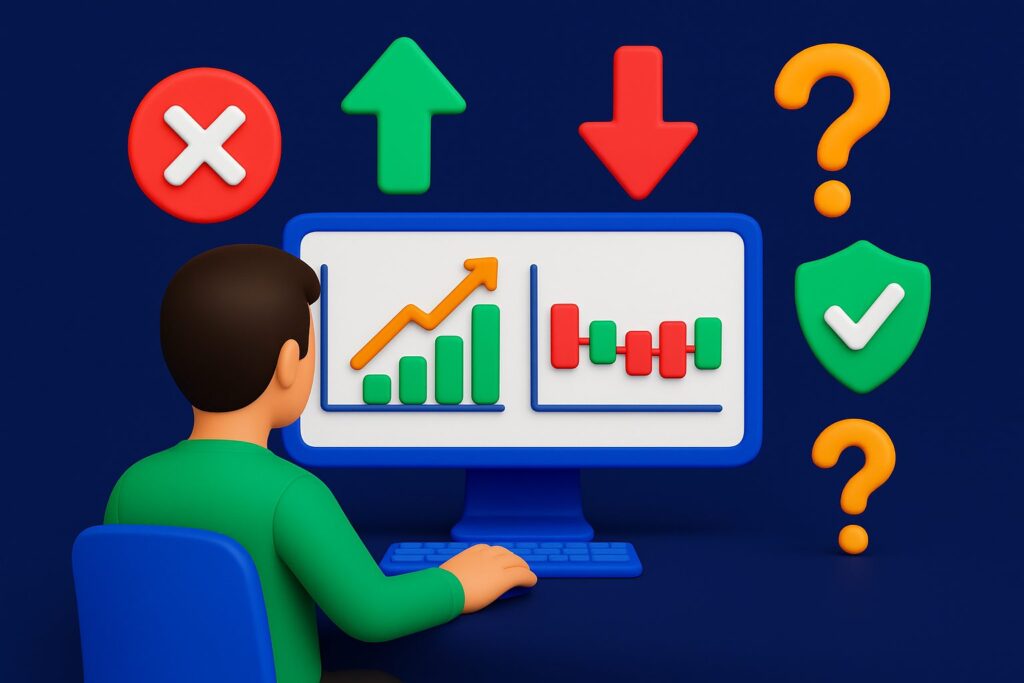
Understanding the market environment in trading is one of the most important skills a trader can develop, especially when learning the basics of forex trading. Before choosing an entry point, setting a stop loss, or executing a strategy, you must correctly identify whether the market is trending or ranging. These two environments operate very differently, and applying the wrong strategy in the wrong environment is one of the quickest ways to lose money.
At DAK Markets, we provide traders with institutional-grade tools on cTrader — enabling you to analyze, adapt, and execute with precision across Forex, indices, commodities, and crypto. This guide breaks down the two major market conditions, how to identify them, and how to trade them effectively.
Why Market Environment Matters
Every chart tells a story. But that story changes depending on whether price is moving directionally or consolidating. Recognizing this early allows traders to:
- Avoid false signals
- Understand trend continuation vs reversal
- Choose the correct strategy (trend-following vs mean-reversion)
- Place safer stop losses
- Avoid entering during indecision phases
A trader who knows how to classify the environment will make better decisions, avoid unnecessary losses, and maximize opportunities during high-probability conditions.
What Is a Trend? (Trending Market Explained)
A trend occurs when the market moves consistently in one direction.
There are two types:
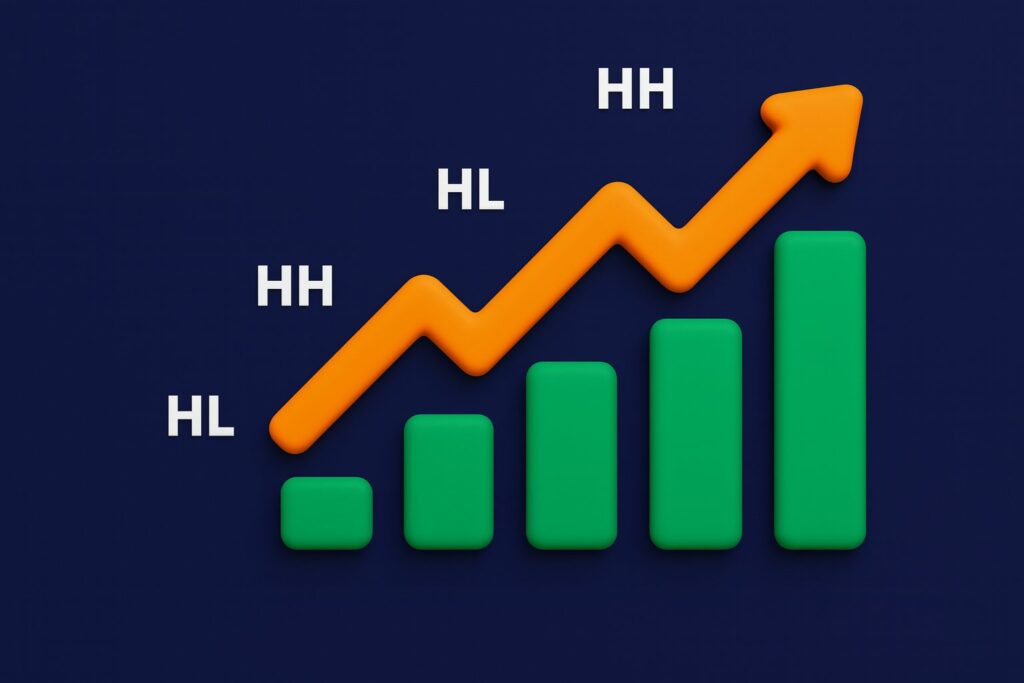
Uptrend
- Characterized by higher highs (HH) and higher lows (HL)
- Demand outweighs supply
- Buyers are in control
- Pullbacks tend to form swing lows before continuing higher
Downtrend
- Characterized by lower lows (LL) and lower highs (LH)
- Supply is dominating
- Sellers maintain control
- Rallies form swing highs before continuation lower
A trend reflects a market with clear direction and momentum. Trend traders aim to join the movement early and stay in the trade until structure shifts.
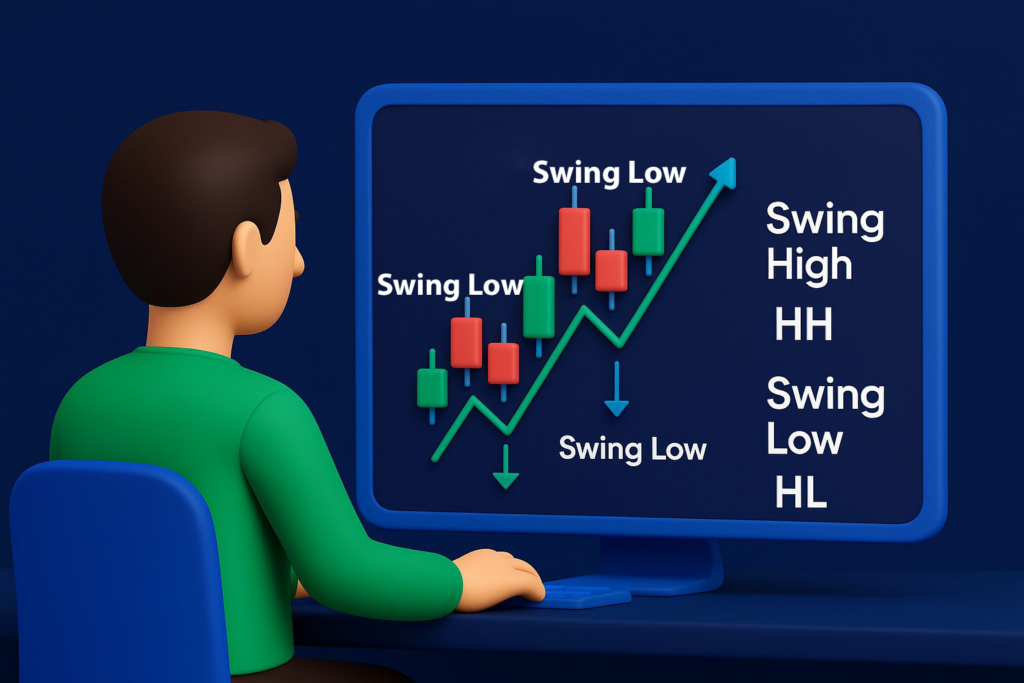
Swing Highs and Swing Lows: The Foundation of Trend Reading
A swing pattern commonly forms with three candles:
- Swing Low → middle candle forms a low; candles on both sides fail to break lower
- Swing High → middle candle forms a high; candles on both sides fail to break higher
These patterns mark the market’s internal structure and are used by traders to identify trend strength, validate continuation, or signal potential reversals.
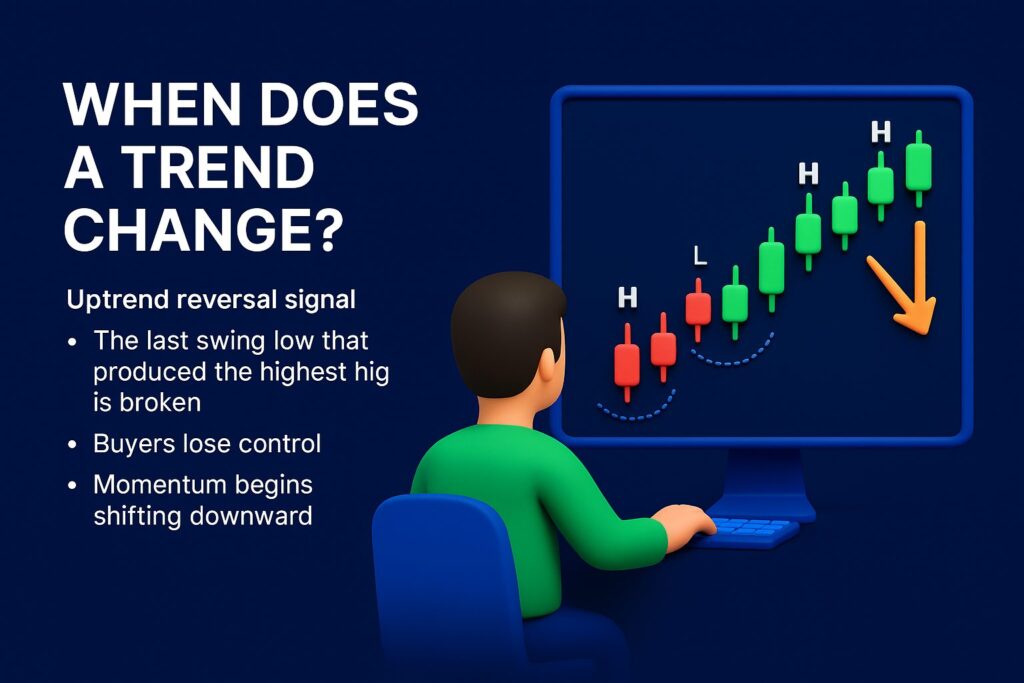
When Does a Trend Change?
A trend may shift when the market violates key structural points.
Uptrend reversal signal
- The last swing low that produced the highest high is broken
- Buyers lose control
- Momentum begins shifting downward
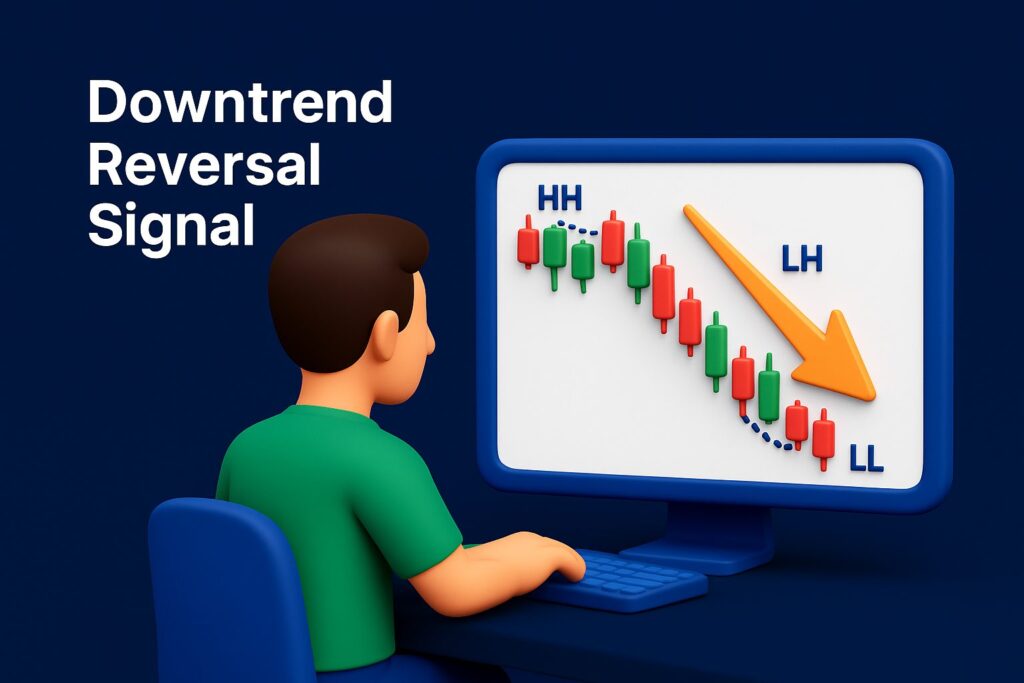
Downtrend reversal signal
- The last swing high that led to the lowest low is broken
- Sellers weaken
- Market begins transitioning upward
This doesn’t always lead to a full reversal — sometimes it simply signals a pause, consolidation, or temporary retracement.
In real markets, price often “wicks” past swing points without creating meaningful change. Traders must confirm structure before assuming a reversal.
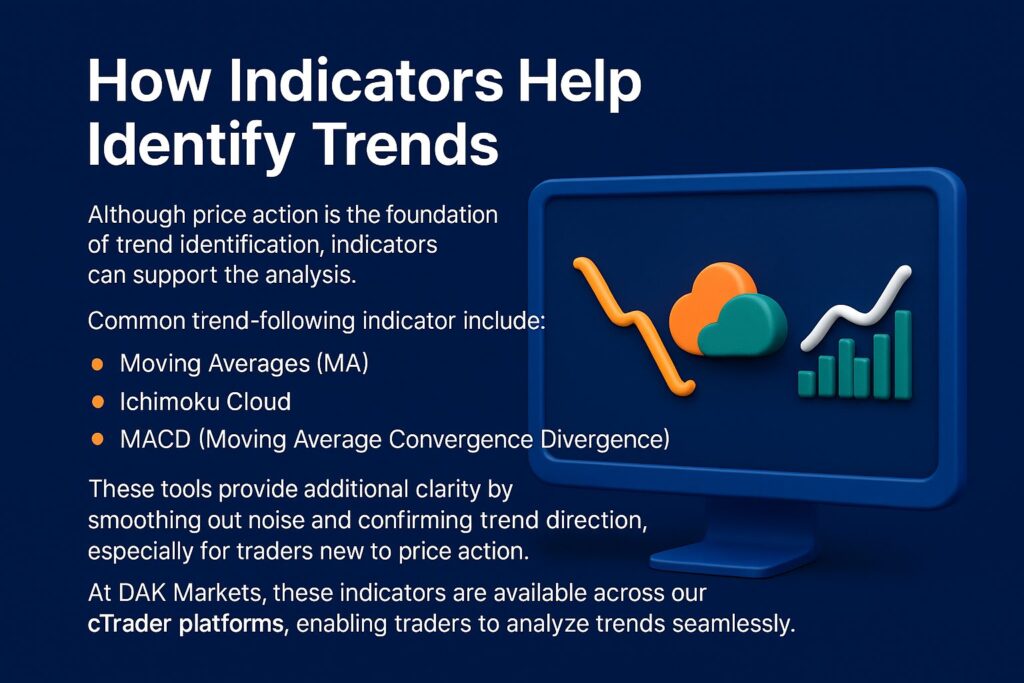
How Indicators Help Identify Trends
Although price action is the foundation of trend identification, indicators can support the analysis.
Common trend-following indicators include:
- Moving Averages (MA)
- Ichimoku Cloud
- MACD (Moving Average Convergence Divergence)
These tools provide additional clarity by smoothing out noise and confirming trend direction, especially for traders new to price action.
At DAK Markets, these indicators are available across our cTrader platforms, enabling traders to analyze trends seamlessly.
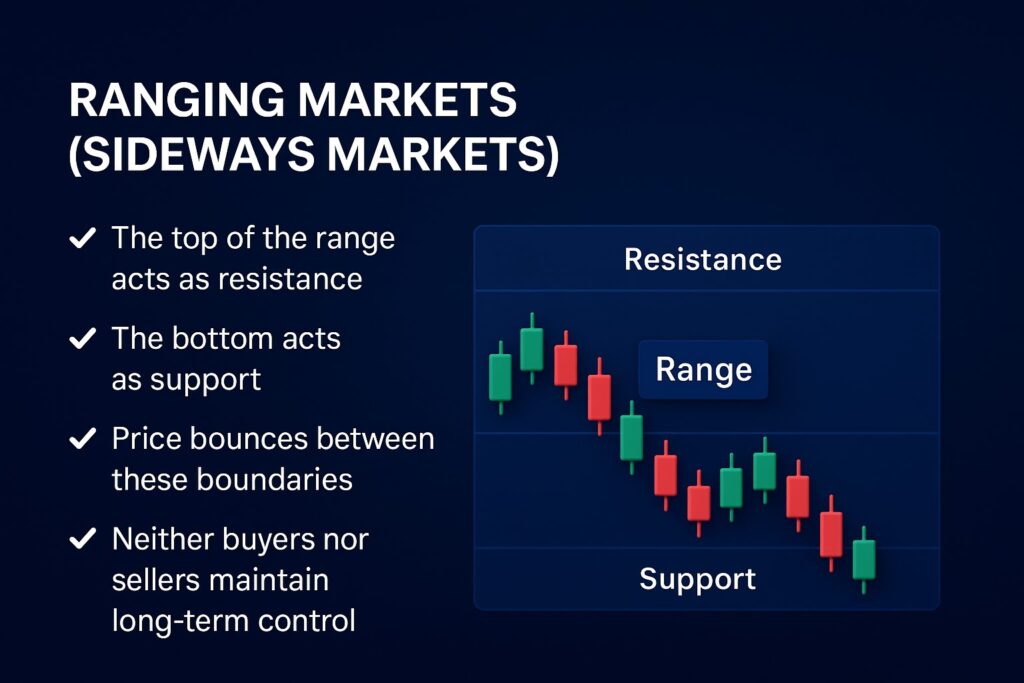
Ranging Markets (Sideways Markets)
A range forms when price oscillates between defined highs and lows.
In this environment:
- The top of the range acts as resistance
- The bottom acts as support
- Price bounces between these boundaries
- Neither buyers nor sellers maintain long-term control
Ranges represent consolidation phases where the market is gathering liquidity before a breakout or preparing for a major directional move.
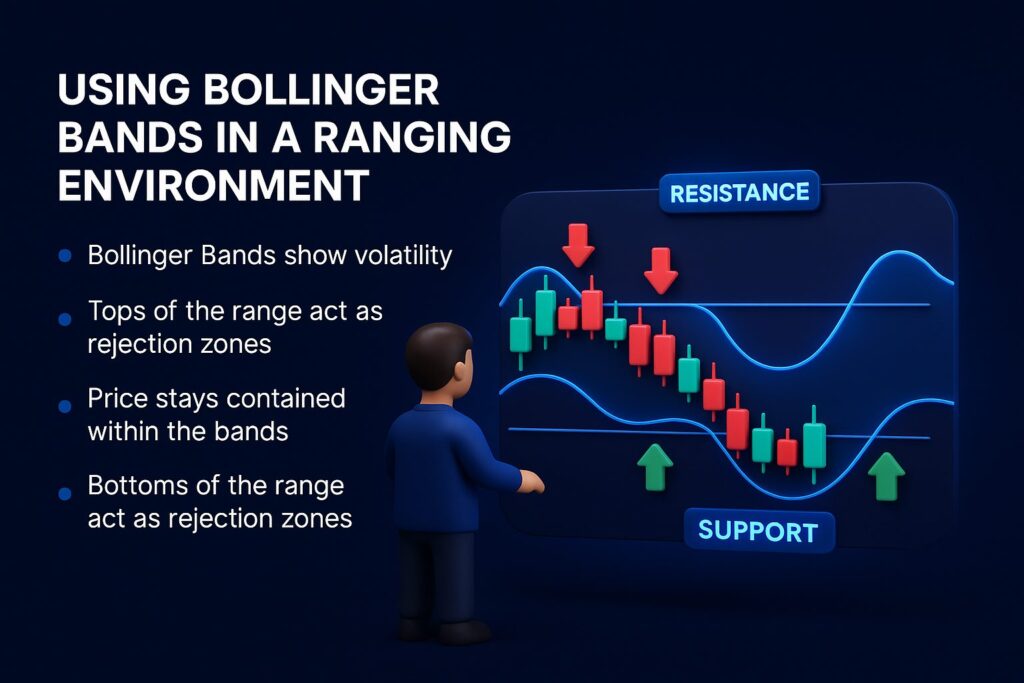
Trading Ranges: Mean-Reversion Logic
When the market ranges, traders do not aim for directional continuation. Instead, they use mean-reversion strategies, which assume price will return to an average level after deviating.
Popular tools for range trading include:
- Bollinger Bands (identify deviation from the mean)
- RSI (overbought/oversold conditions)
- Stochastic Oscillator (momentum shifts within the range)
- Volume Weighted Average Price (VWAP)
- Simple/Exponential Moving Averages
These indicators help traders determine when price has stretched too far from equilibrium and may revert back toward the center of the range.
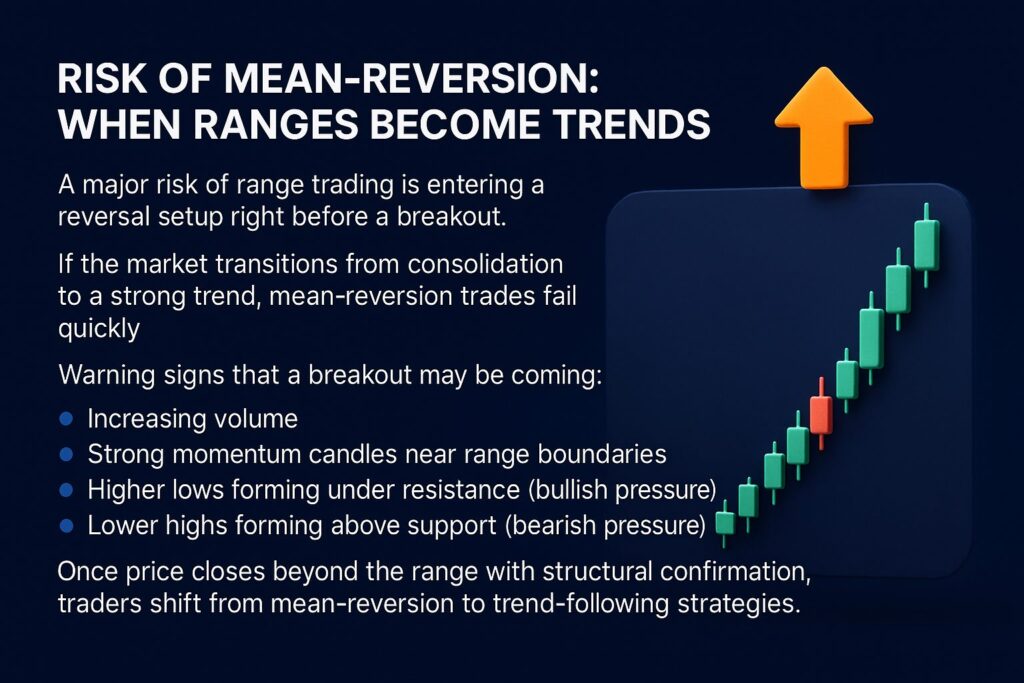
Risk of Mean-Reversion: When Ranges Become Trends
A major risk of range trading is entering a reversal setup right before a breakout.
If the market transitions from consolidation to a strong trend, mean-reversion trades fail quickly.
Warning signs that a breakout may be coming:
- Increasing volume
- Strong momentum candles near range boundaries
- Higher lows forming under resistance (bullish pressure)
- Lower highs forming above support (bearish pressure)
- Fundamental catalysts or economic events approaching
Once price closes beyond the range with structural confirmation, traders shift from mean-reversion to trend-following strategies.
Which Market Environment Is More Profitable?
Both can be profitable — depending on your strategy and personality.
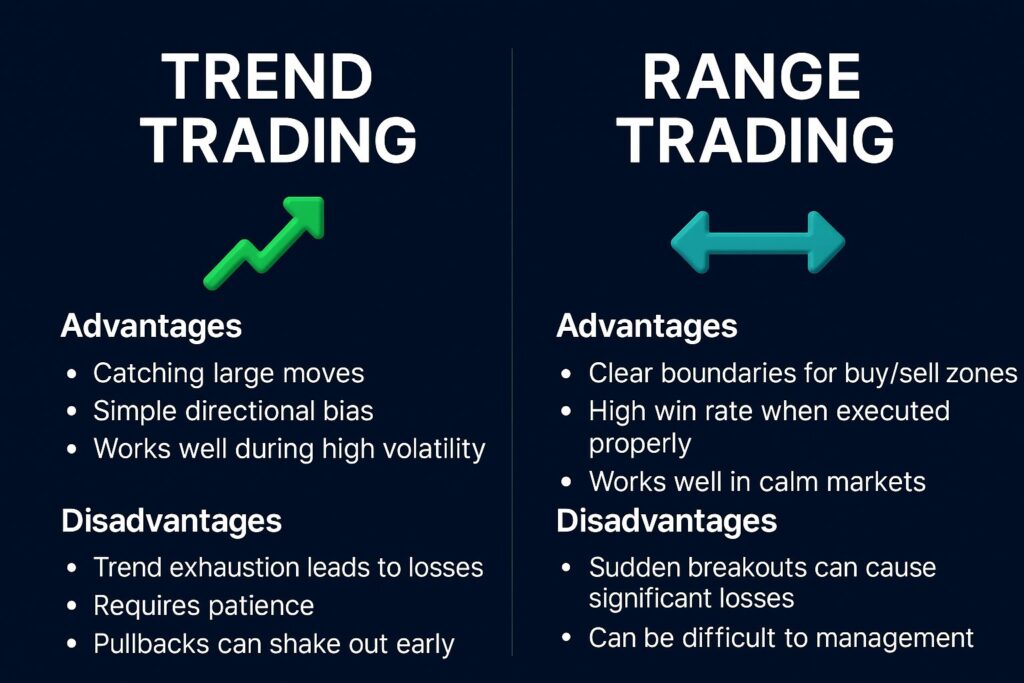
Trend-Trading Advantages
- Catching large moves
- Simple directional bias
- Works well during high volatility
- Strong risk-reward potential
Trend-Trading Disadvantages
- Trend exhaustion leads to losses
- Requires patience
- Pullbacks can shake out early entries
Range-Trading Advantages
- Clear boundaries for buy/sell zones
- High win rate when executed properly
- Works well in calm markets
Range-Trading Disadvantages
- Sudden breakouts can cause significant losses
- Requires strict risk management
- Can be difficult to identify the true center/mean
Market conditions constantly change, making flexibility the most important trait for consistent profitability.
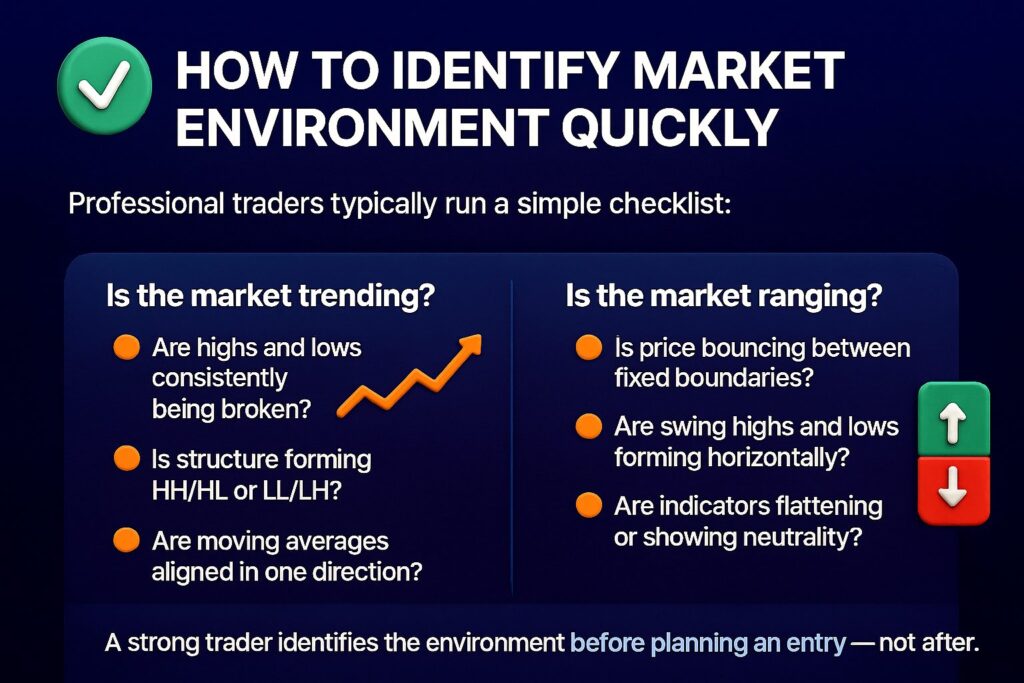
How to Identify Market Environment Quickly
Professional traders typically run a simple checklist:
Is the market trending?
- Are highs and lows consistently being broken?
- Is structure forming HH/HL or LL/LH?
- Are moving averages aligned in one direction?
Is the market ranging?
- Is price bouncing between fixed boundaries?
- Are swing highs and lows forming horizontally?
- Are indicators flattening or showing neutrality?
A strong trader identifies the environment before planning an entry — not after.
Final Thoughts: Adaptability Wins
Market conditions are dynamic. A strategy that works flawlessly in a trend may fail entirely in a range, and vice versa. Successful traders adapt their approach based on what the market is actually doing—not what they hope it will do.
With DAK Markets‘ advanced cTrader tools, real-time execution, and multi-asset access, you can analyze trends and ranges with accuracy, trade confidently, and improve your long-term consistency.