In the world of technical analysis, very few tools are as widely recognized—or as widely misunderstood—as the Fibonacci retracement and extension levels. These tools have been used for decades across Forex, commodities, indices, and even crypto. Despite their popularity, many traders don’t fully understand why they work or how to apply them correctly.
At DAK Markets, we aim to provide traders with institutional-grade tools, education, and infrastructure. Understanding the logic behind Fibonacci levels can help you make more informed decisions, identify key zones of interest, and improve both trade timing and risk management.
This article serves as a complete guide to Fibonacci trading, covering how the levels are calculated, why they matter, and how you can apply them with precision.
What Are Fibonacci Retracements?
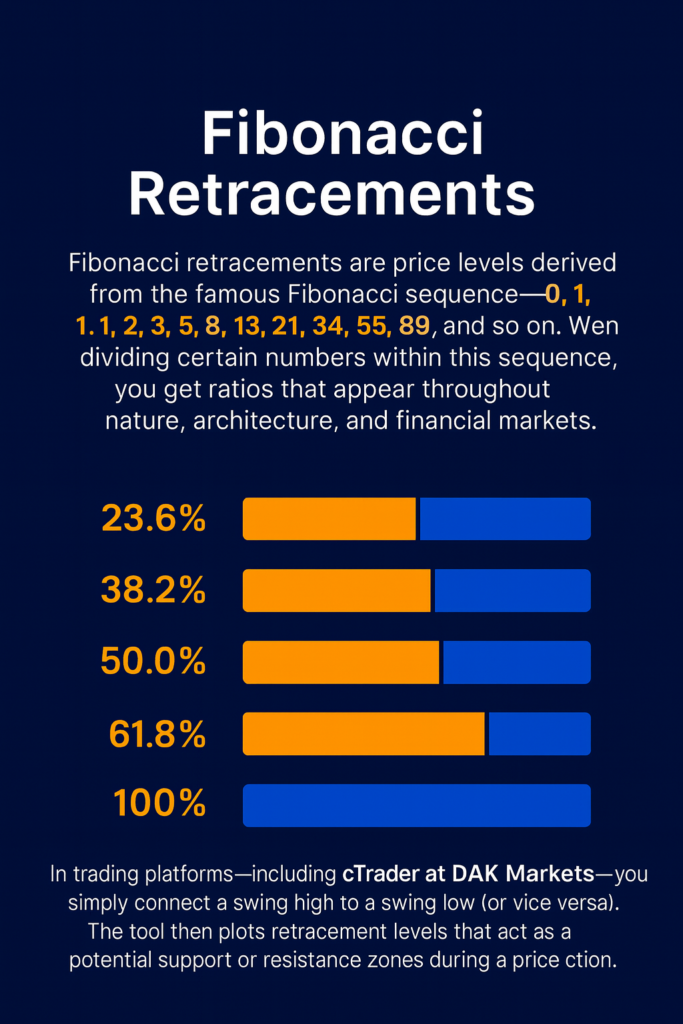
Fibonacci retracements are price levels derived from the famous Fibonacci sequence—0, 1, 1, 2, 3, 5, 8, 13, 21, 34, 55, 89, and so on. When dividing certain numbers within this sequence, you get ratios that appear throughout nature, architecture, and financial markets.
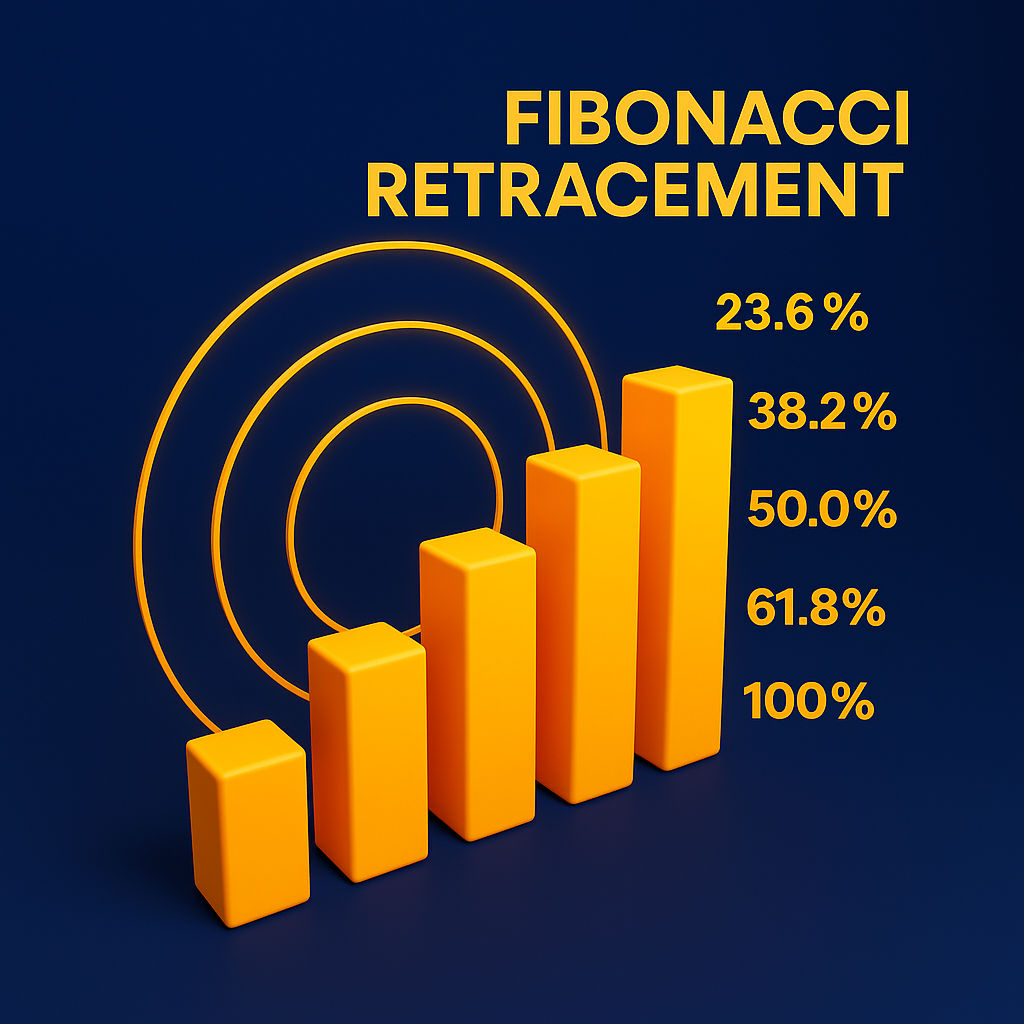
These ratios form the basis of Fibonacci retracement levels, most commonly:
- 23.6%
- 38.2%
- 50.0%
- 61.8%
- 100%
In trading platforms—including cTrader at DAK Markets—you simply connect a swing high to a swing low (or vice versa). The tool then plots retracement levels that act as potential support or resistance zones during a price correction.
Why Do Fibonacci Levels Work?
Despite myths suggesting a mystical or natural force behind Fibonacci ratios, the real reason they work is simple:
Because millions of traders watch them.
Technical analysis works when large groups of traders treat the same levels as important. When enough traders react to Fibonacci levels, market behavior becomes self-fulfilling.
The most respected Fibonacci levels are:
- 38.2% — Often the first reaction point in a strong trend
- 50% — Not a true Fibonacci number, but a crucial psychological midpoint
- 61.8% — Known as the golden ratio, and one of the strongest reversal zones
The 61.8% level is especially influential because institutions and algorithmic strategies frequently incorporate it into their models.
How Traders Use Fibonacci Retracements
Fibonacci retracements are not standalone strategies—they are used as contextual confluence tools to help identify areas where price may:
- Pause
- Reverse
- Continue trending
- Reject or bounce
Below are the most common applications:
1. Identifying Pullback Zones in Trends
During a trending market, price rarely moves in a straight line. It pulls back, retraces, gathers liquidity, and then continues.
Fibonacci helps traders pinpoint the area where a retracement may end.
For example, in a strong uptrend:
- A pullback to the 38.2% level may suggest aggressive bullish continuation.
- A deeper pullback toward 50% or 61.8% offers better risk-to-reward for swing traders.
2. Mapping Stop Loss and Take Profit Levels
Many traders place stops just beyond key Fibonacci levels or use the levels to scale out of positions.
For example:
- Enter at 50% retracement
- Stop loss below 61.8%
- Target back to 0% or even extension levels
This offers a clean, rules-based structure—particularly useful in volatile markets like XAUUSD or NASDAQ.
3. Confluence With Market Structure
The most powerful use of Fibonacci retracement is when it aligns with:
- Supply and demand zones
- Liquidity pools
- Trendlines
- Previous highs/lows
- Breaker blocks
- Institutional orderflow zones
When Fibonacci aligns with real liquidity points, probability increases significantly.
What Is Fibonacci Extension?
While Fibonacci retracement identifies pullback zones, Fibonacci extension levels help traders predict potential future support and resistance—especially during price discovery.
Fibonacci extension levels such as:
- 127.2%
- 161.8%
- 200%
- 261.8%
are used to project where price might move after breaking out of a structure.
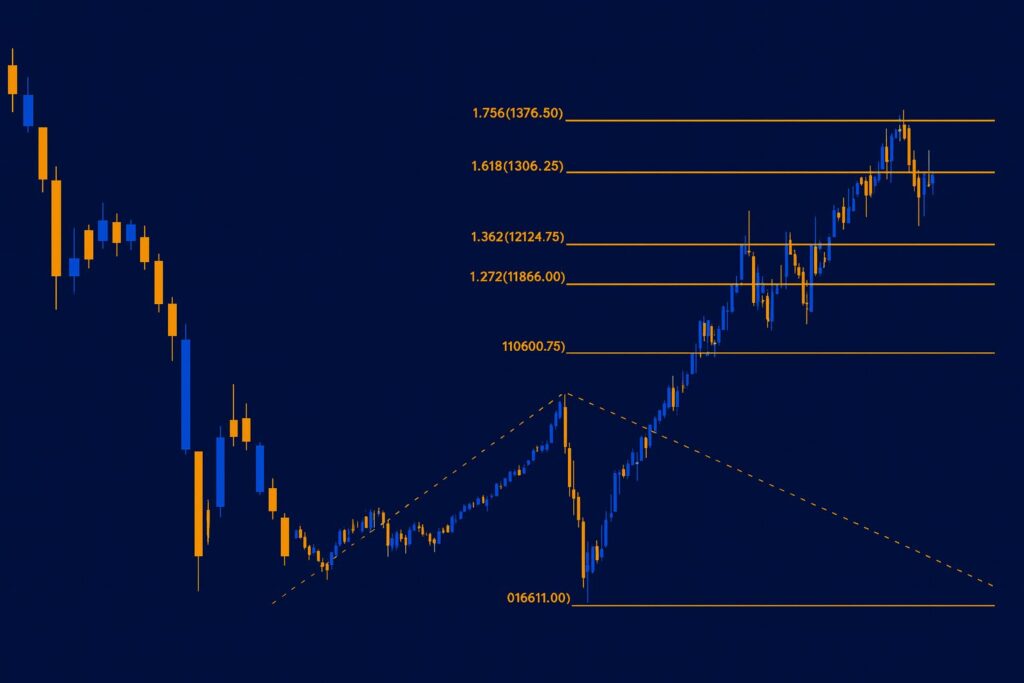
When Traders Use Extensions
- When an asset breaks above the previous all-time high
- During impulsive moves in trending markets
- When mapping take-profit levels beyond familiar price zones
For example, the NASDAQ index often uses Fibonacci extension levels during bullish price expansions after major breakouts.
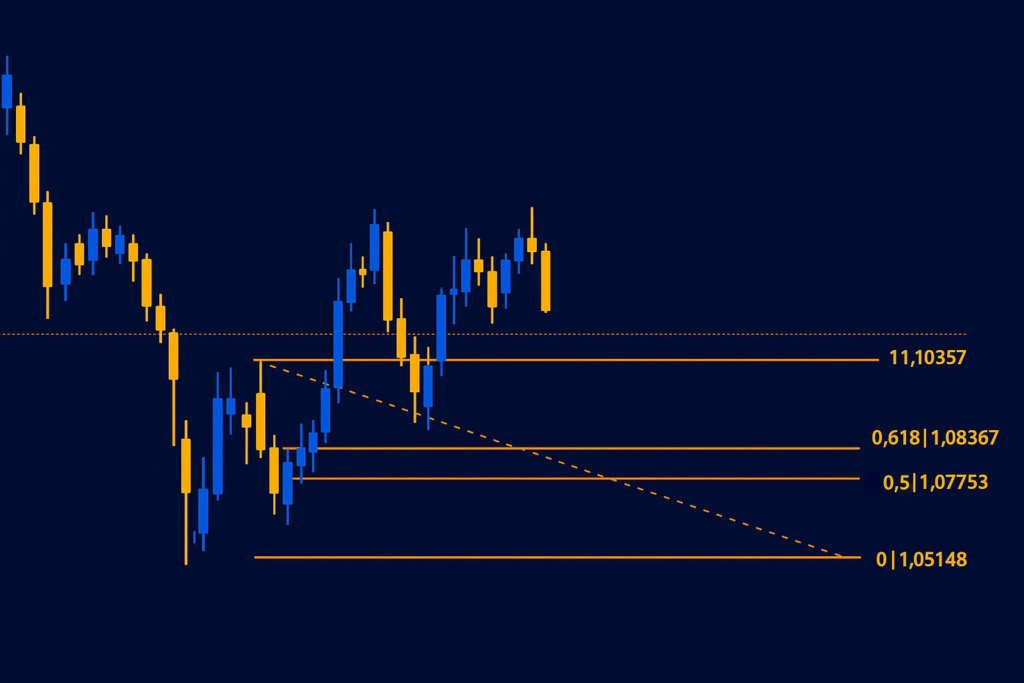
Real Example: How Fibonacci Helps Traders
Consider a market like EURUSD or NAS100. When traders plot Fibonacci from a swing low to swing high during a retracement, they may notice:
- 61.8% often provides a strong bounce
- 50% frequently acts as a midpoint reaction
- 38.2% supports shallow pullbacks in strong trends
If price reacts in these zones and shows confirmations such as:
- Rejection candles
- Breaks of structure
- Volume spikes
- Divergence signals
A trader can use Fibonacci levels to structure high-probability entries with well-defined stop losses.
Why Fibonacci Is Not a Standalone Strategy
Many beginners misuse Fibonacci by applying it randomly without understanding the broader context. Fibonacci should never be used alone.
Weak Fibonacci usage includes:
- Using it in choppy, sideways ranges
- Applying it without identifying market structure
- Trading the level blindly without confirmation
- Relying on Fibs instead of understanding liquidity
The most successful traders use Fibonacci as a supportive tool—one that aligns with:
- Trend bias
- HTF analysis (higher timeframe structure)
- Supply & demand
- Institutional orderflow concepts
- Volume profile
At DAK Markets, our advanced charting tools on cTrader allow users to combine Fibonacci with multiple confluence rules for optimal precision.
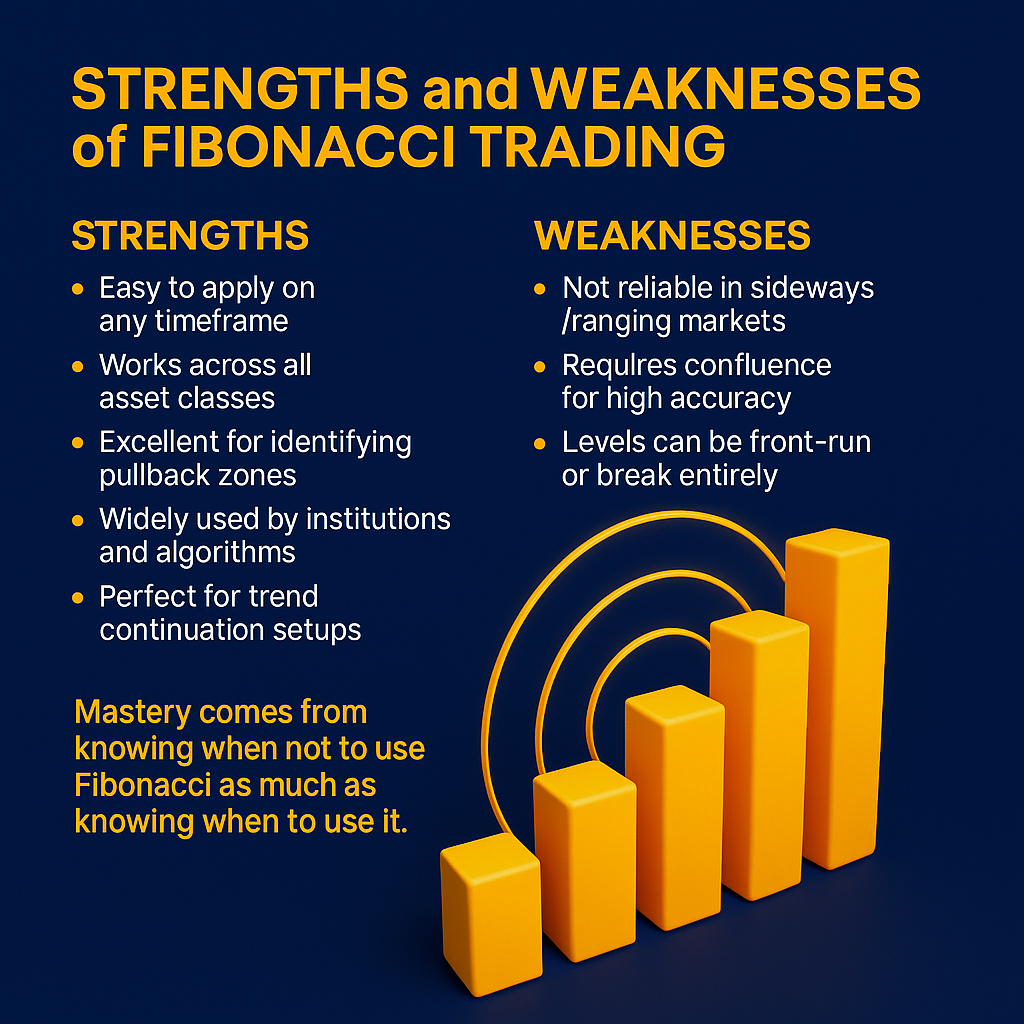
Strengths and Weaknesses of Fibonacci Trading
Strengths
- Easy to apply on any timeframe
- Works across all asset classes
- Excellent for identifying pullback zones
- Widely used by institutions and algorithms
- Perfect for trend continuation setups
Weaknesses
- Not reliable in sideways/ranging markets
- Requires confluence for high accuracy
- Levels can be front-run or break entirely
- Traders may over-rely on Fibonacci alone
Mastery comes from knowing when not to use Fibonacci as much as knowing when to use it.
Risk Management: The Key to Successful Fibonacci Trading
Even when Fibonacci levels align with market structure, price does not always react as expected. For this reason, risk management is essential.
Safe practices include:
- Always placing stops beyond the next major level
- Avoiding oversized positions when relying on Fibonacci
- Seeking confirmation candles before entry
- Using multi-timeframe analysis
- Avoiding Fibonacci setups during high-impact news
With proper risk management, Fibonacci becomes a powerful enhancement to a trader’s toolkit—not a dependency.