
Successful trading involves more than finding a strong market entry. Traders also need to understand what happens after a position is opened.
One useful performance metric for doing this is Maximum Favorable Excursion, commonly known as MFE.
Maximum Favorable Excursion measures the greatest unrealized profit a trade reaches while it remains open. By reviewing MFE across multiple trades, traders can better understand how price typically behaves after entry and whether their exit strategy is making effective use of favorable market movement.
Rather than focusing only on whether a trade ultimately won or lost, MFE provides another layer of information that can help traders evaluate:
- Trade management
- Profit targets
- Exit timing
- Strategy consistency
- Historical trade behavior

What Is Maximum Favorable Excursion?
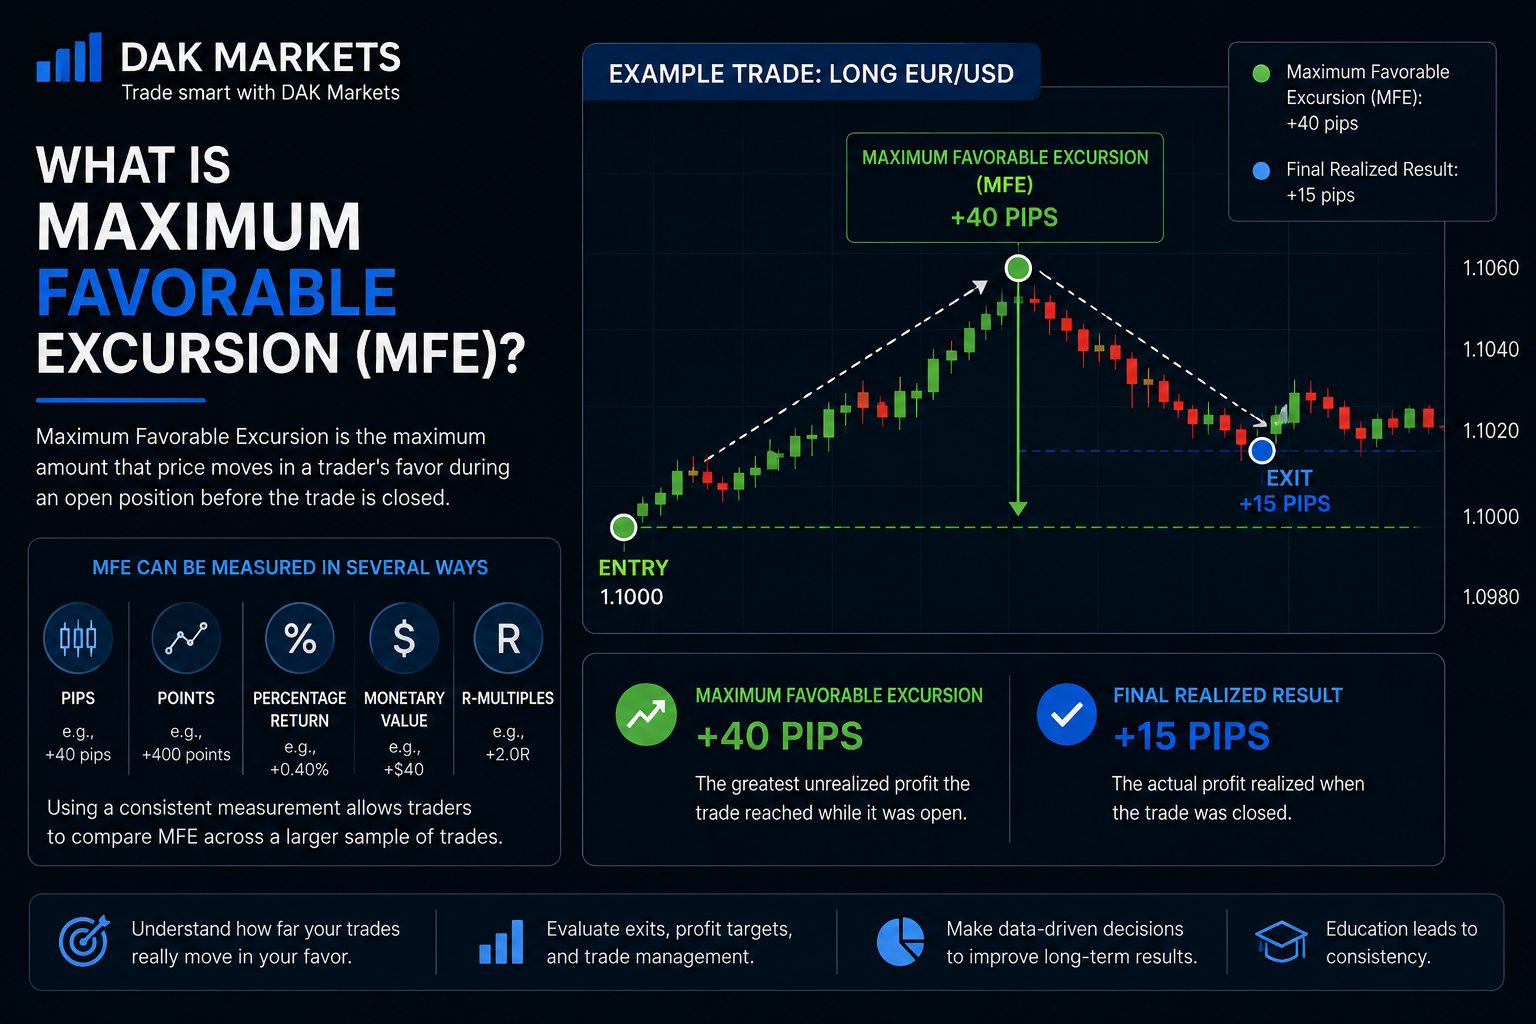
Maximum Favorable Excursion is the maximum amount that price moves in a trader’s favor during an open position before the trade is closed.
Example
Imagine a trader buys EUR/USD.
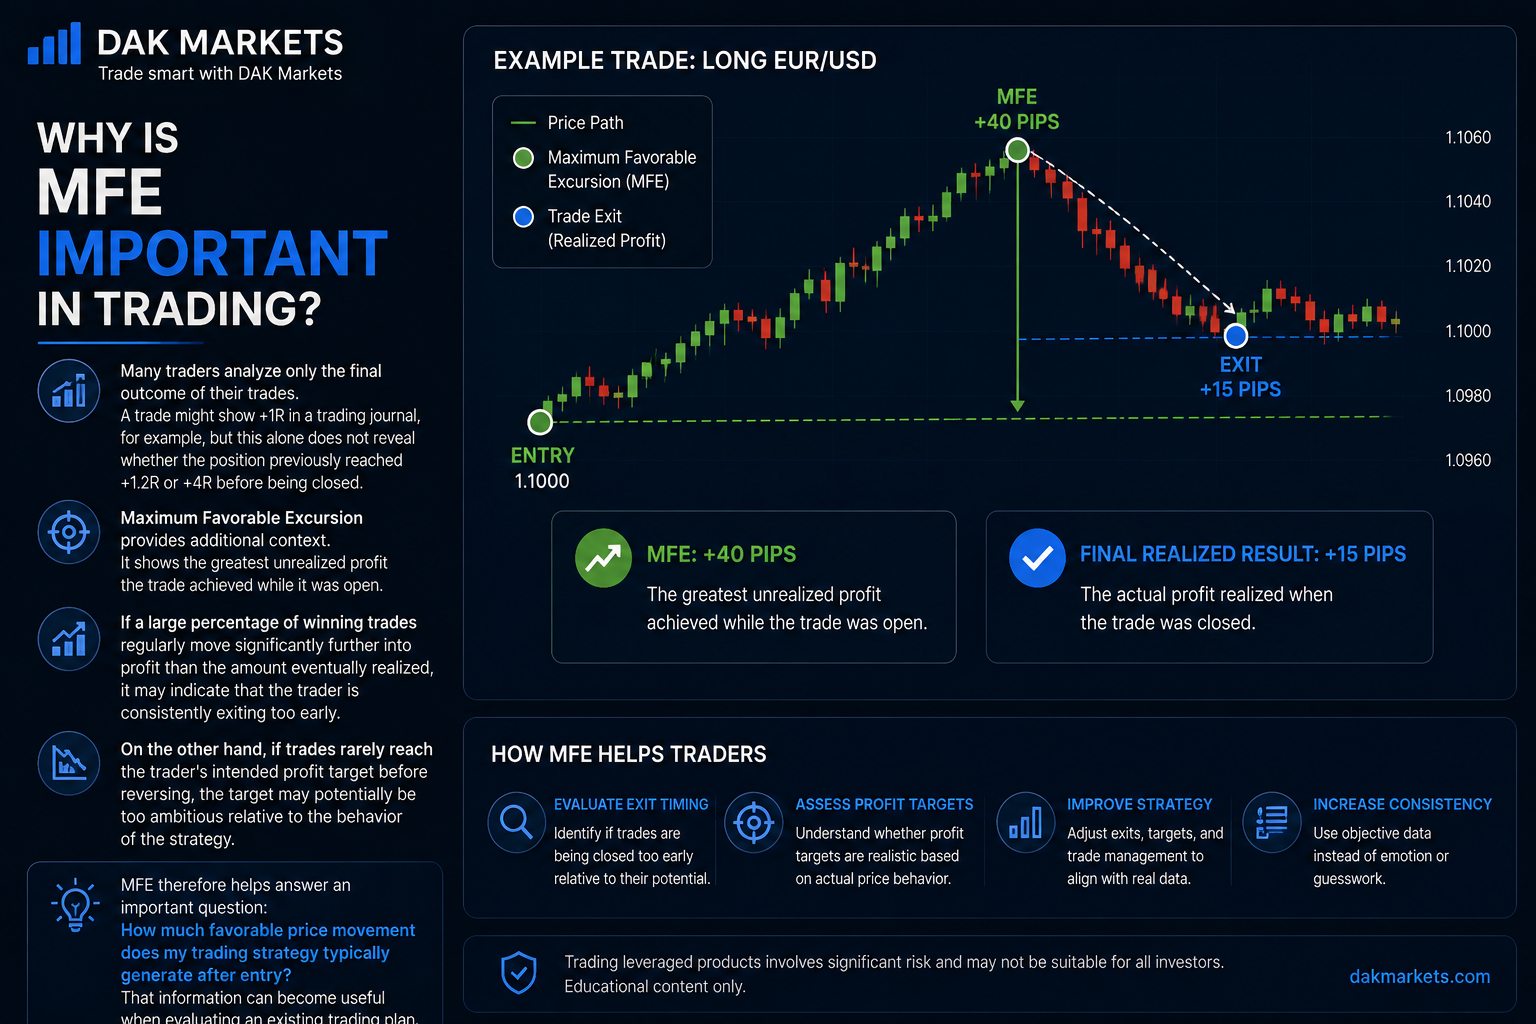
The position eventually moves 40 pips into profit, but the market later reverses. The trader eventually closes the position with only 15 pips of realized profit.
In this example:
| Metric | Result |
|---|---|
| Maximum Favorable Excursion | +40 pips |
| Final Realized Result | +15 pips |
The trade therefore reached 40 pips of unrealized profit at its most favorable point, even though only 15 pips were ultimately realized.
How Can MFE Be Measured?
MFE can be expressed using several different performance metrics, including:
- Pips
- Points
- Percentage return
- Monetary value
- R-multiples
The important factor is consistency. Using the same measurement across your trades makes it easier to compare performance and identify patterns over a larger sample.
Why Is MFE Important in Trading?
Many traders focus almost entirely on the final outcome of a position.
For example, a trade may show +1R in a trading journal.
However, that result alone does not reveal whether the trade previously reached:
- +1.2R
- +2R
- +3R
- or even +4R
before it was closed.
This is where Maximum Favorable Excursion becomes useful.
MFE provides additional context about how much favorable movement actually occurred while the trade was open.
If a large percentage of winning trades consistently move significantly further into profit than the amount eventually realized, it may indicate that the trader is closing profitable positions too early.
On the other hand, if trades repeatedly reverse before reaching the planned take-profit level, the target may be too ambitious relative to the historical behavior of the strategy.
The Key Question MFE Helps Answer
How much favorable price movement does my trading strategy typically generate after entry?
That information can be extremely useful when reviewing and refining an existing trading plan.
Can MFE Show If You Are Exiting Trades Too Early?
One of the most practical uses of MFE is evaluating exit efficiency.
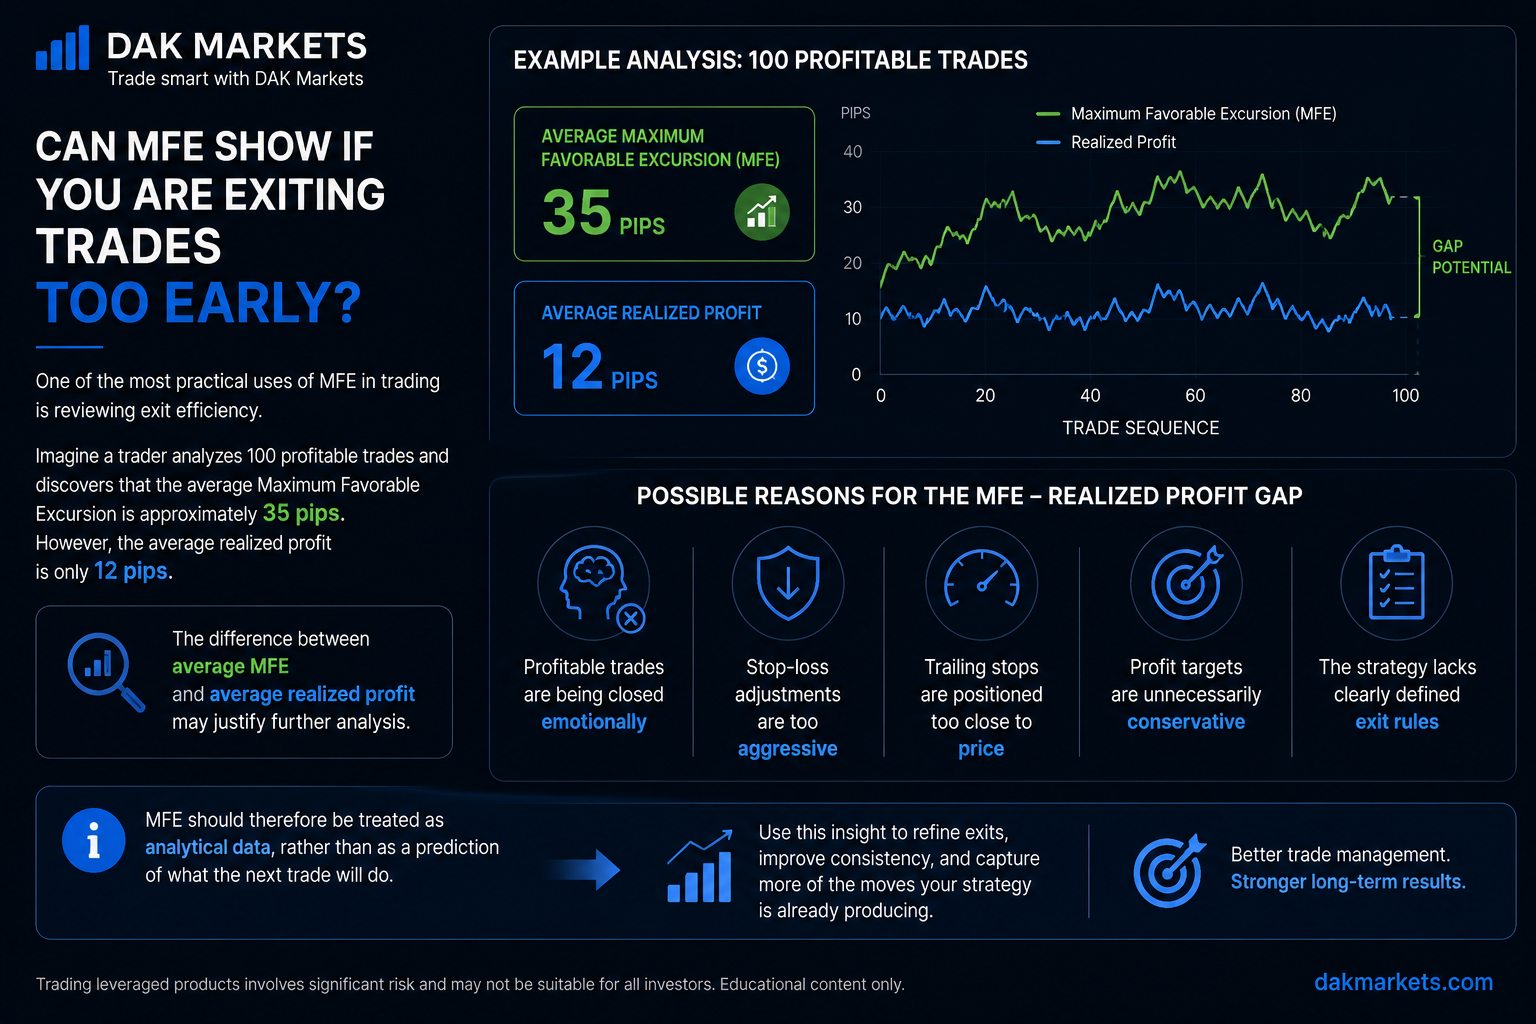
Imagine a trader reviews 100 profitable trades and discovers:
- Average MFE: 35 pips
- Average realized profit: 12 pips
That difference does not automatically mean every take-profit target should be increased to 35 pips.
Markets are uncertain, and the exact maximum favorable movement can only be identified after it has already occurred.
However, a consistent gap between MFE and realized profit may justify further analysis.
A trader could investigate whether:
- Profitable trades are being closed emotionally
- Stop-loss adjustments are too aggressive
- Trailing stops are positioned too close to price
- Profit targets are unnecessarily conservative
- The strategy lacks clearly defined exit rules
Important
MFE should be treated as analytical data, not as a prediction of what the next trade will do.
Its purpose is to help traders recognize patterns in historical performance.
MFE and Take-Profit Targets
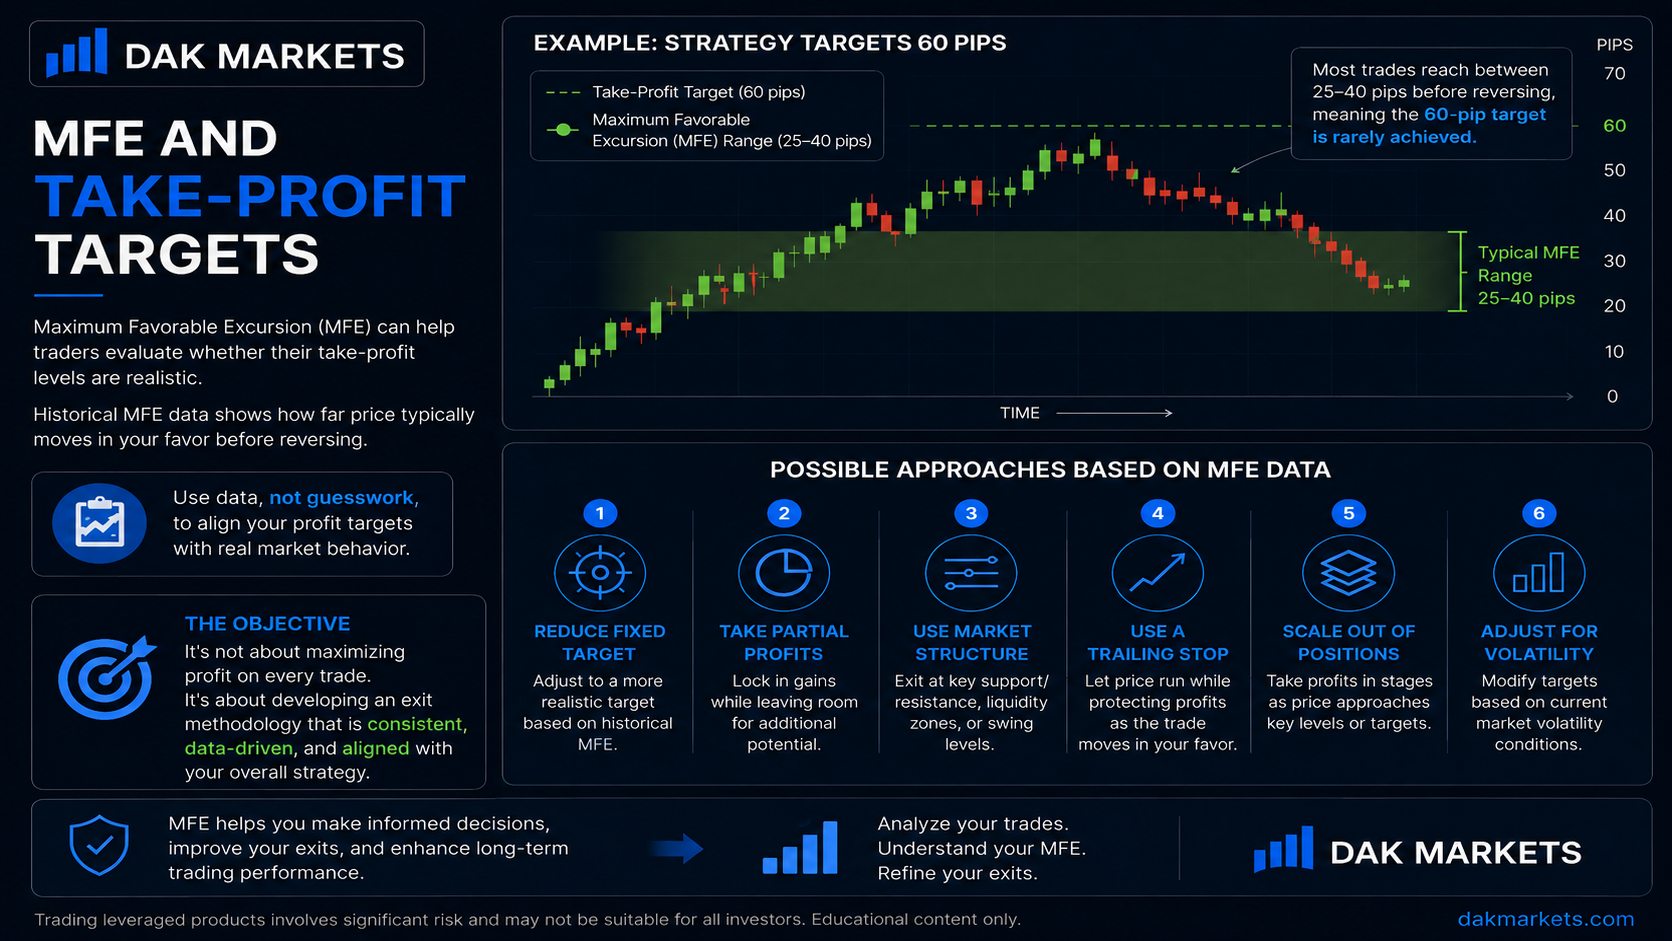
Maximum Favorable Excursion can also help traders determine whether their take-profit targets are realistic.
Suppose a trading strategy consistently targets 60 pips.
After reviewing historical performance, the trader discovers that most successful setups only achieve an MFE of approximately 25 to 40 pips before reversing.
This could suggest that the 60-pip target is rarely reached under normal conditions.
The trader may then test alternative approaches, such as:
- Reducing the fixed take-profit target
- Taking partial profits
- Using market structure for exits
- Using a trailing stop
- Scaling out of positions
- Adjusting targets based on volatility
The objective is not necessarily to maximize the profit of every individual trade.
Instead, historical MFE data can help traders develop an exit methodology that is better aligned with the behavior of their overall strategy.
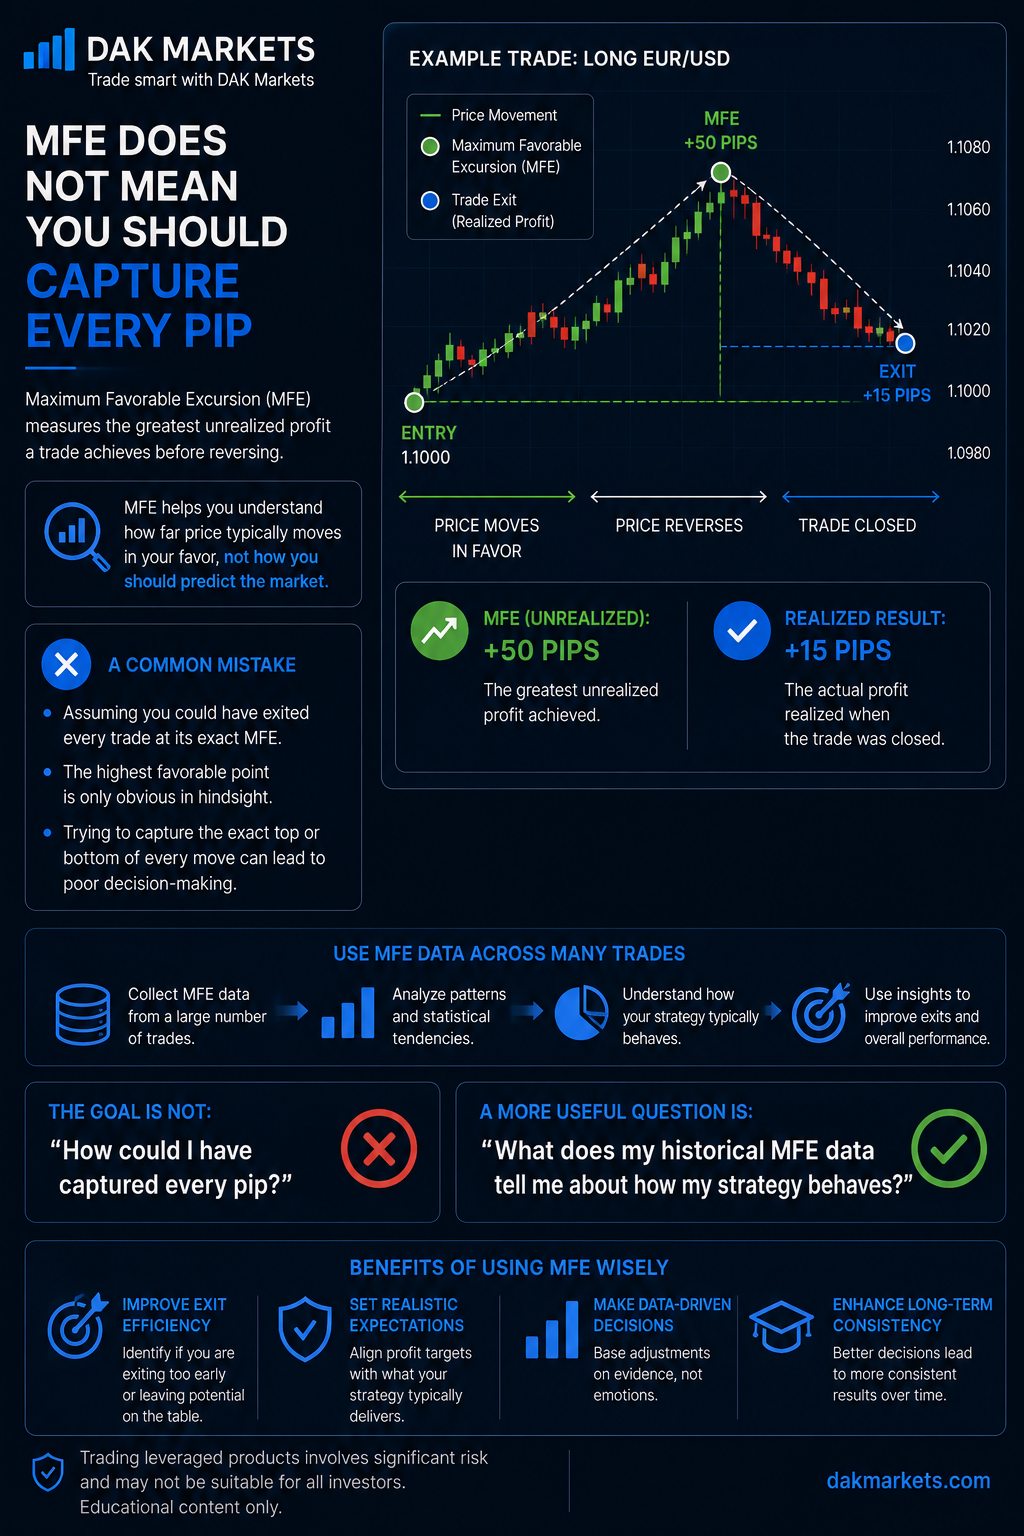
MFE Does Not Mean You Should Capture Every Pip
A common mistake when first learning about Maximum Favorable Excursion is assuming that traders should have exited every position at its exact MFE.
That is unrealistic.
The highest favorable point of a trade becomes obvious only after price has already moved away from it.
For example, imagine a trade reaches +50 pips before reversing.
There was no way to know with certainty at +50 pips that this would be the exact maximum favorable point.
Trying to capture the precise top or bottom of every market movement can lead to poor decision-making.
Instead, traders should use MFE data across a larger sample of trades to identify statistical tendencies and recurring patterns.
The Wrong Question
“How could I have captured every pip?”
A Better Question
“What does my historical MFE data tell me about how my strategy behaves?”
That shift in thinking turns MFE from a hindsight-based metric into a practical tool for strategy analysis.
How to Track Maximum Favorable Excursion
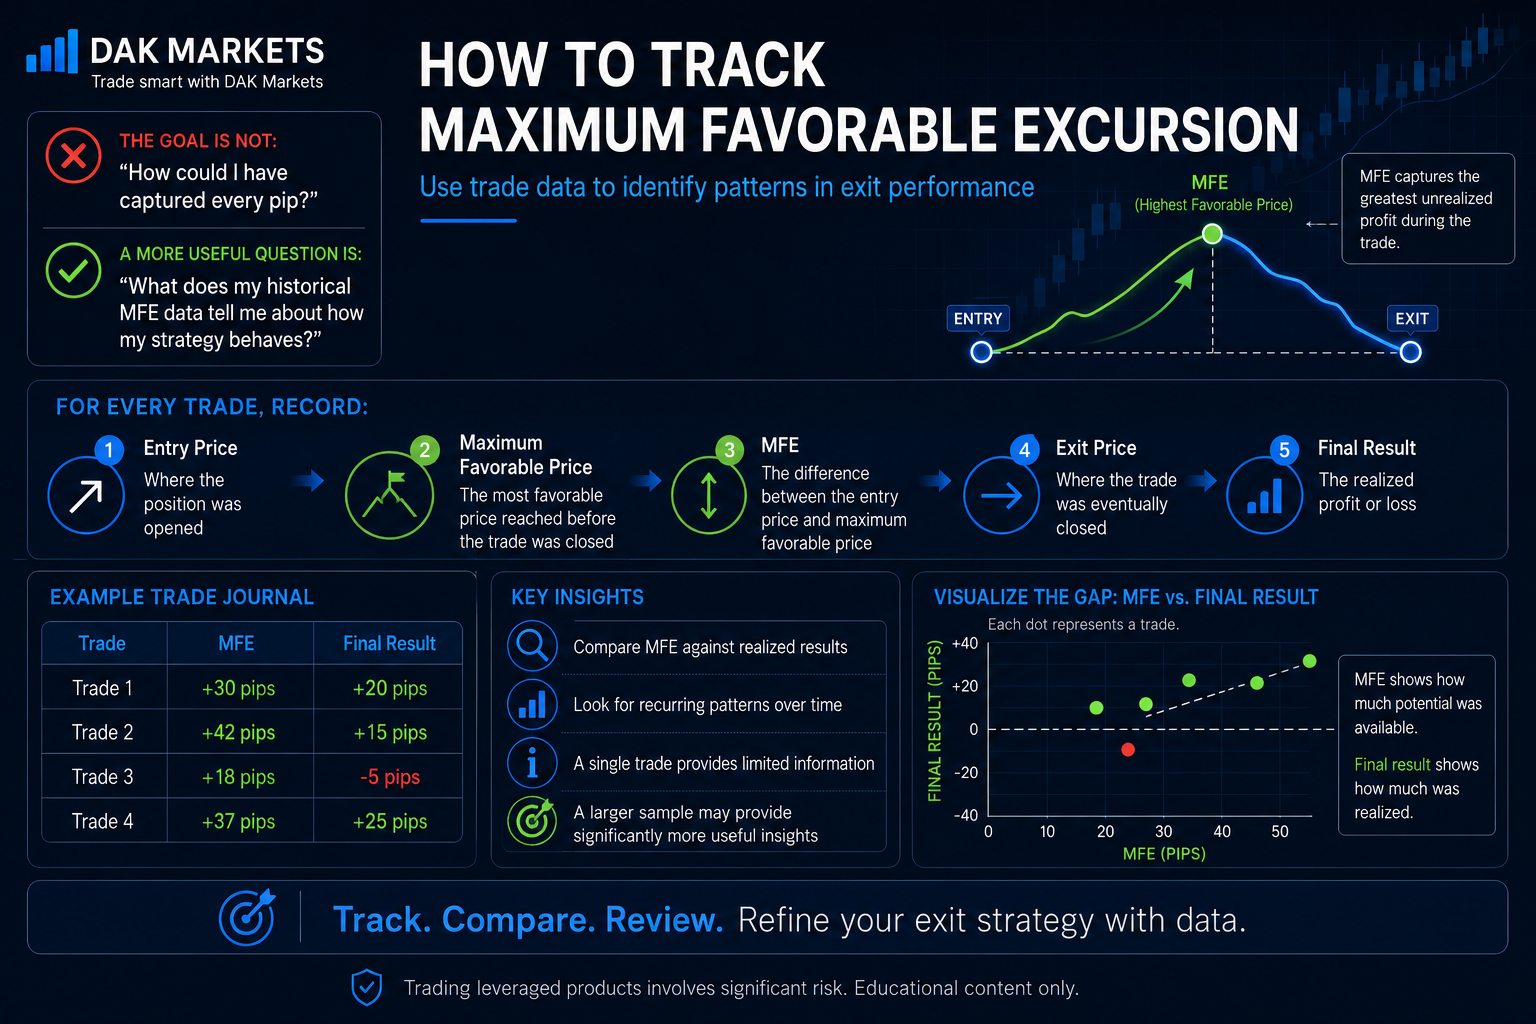
Traders can calculate MFE manually through a trading journal or use trading analytics software that records maximum favorable movement automatically.
For every trade, consider recording the following information:
1. Entry Price
The price at which the position was opened.
2. Maximum Favorable Price
The most favorable price reached while the trade remained open.
3. MFE
The difference between the entry price and the maximum favorable price.
4. Exit Price
The price at which the trade was eventually closed.
5. Final Result
The realized profit or loss from the position.
Example Trading Journal
| Trade | MFE | Final Result |
|---|---|---|
| Trade 1 | +30 pips | +20 pips |
| Trade 2 | +42 pips | +15 pips |
| Trade 3 | +18 pips | -5 pips |
| Trade 4 | +37 pips | +25 pips |
Over time, traders can compare MFE against realized results to identify recurring patterns.
A single trade provides limited information.
A larger sample may provide significantly more meaningful insights.
Maximum Favorable Excursion vs Maximum Adverse Excursion
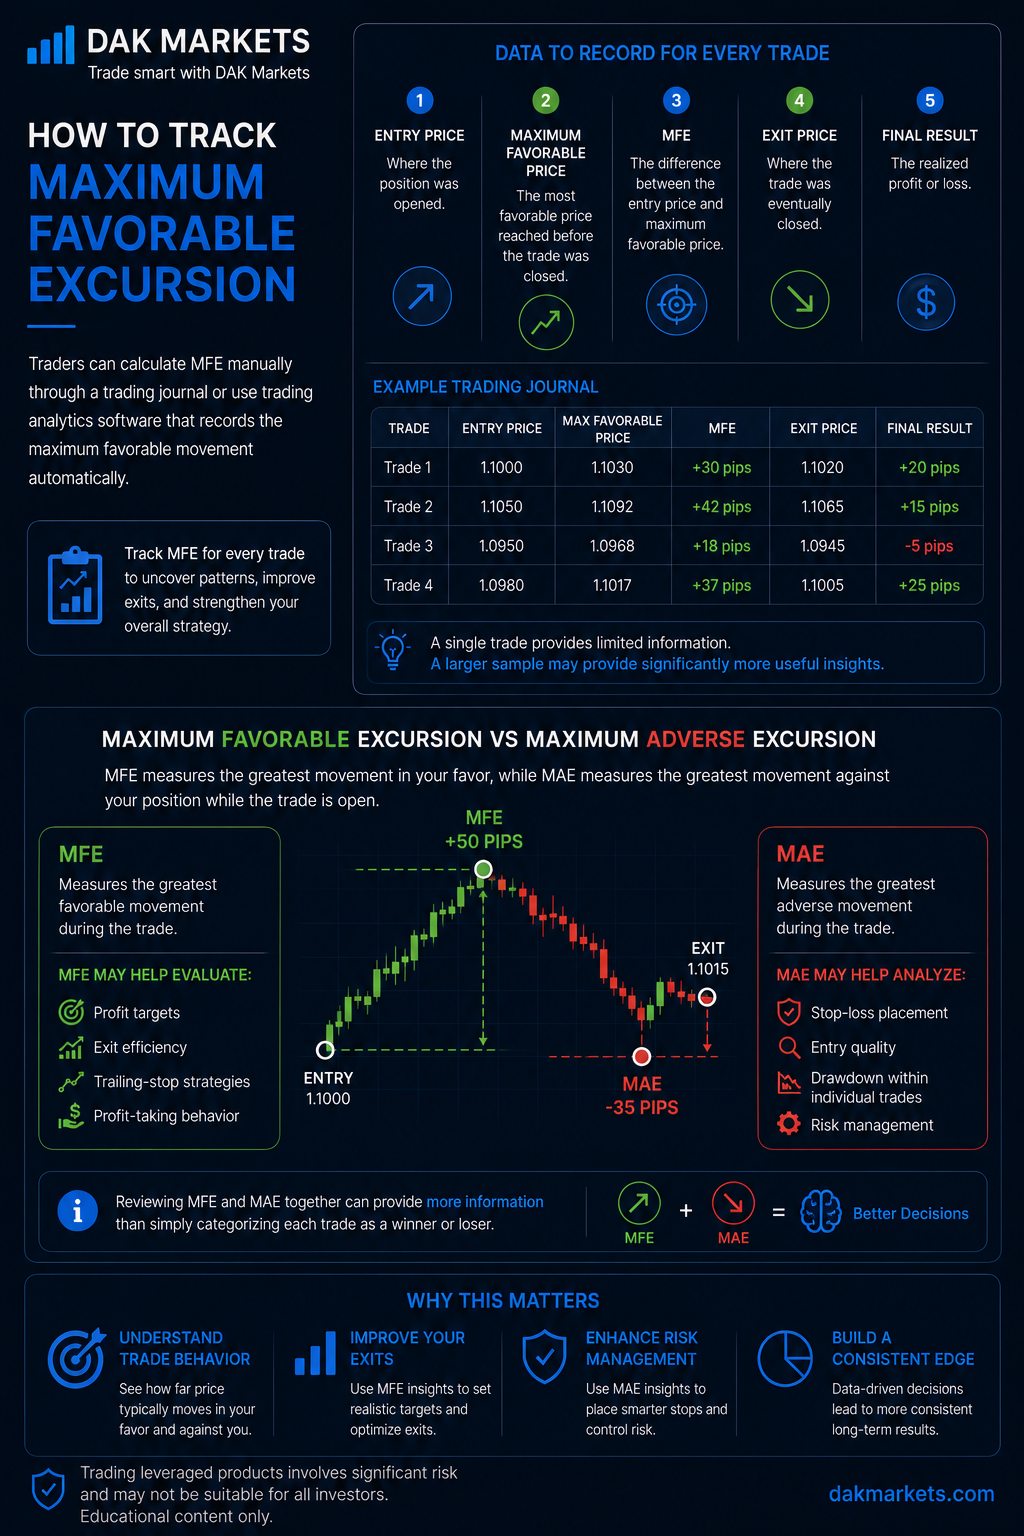
Maximum Favorable Excursion is often analyzed alongside Maximum Adverse Excursion, or MAE.
The two metrics measure opposite sides of trade behavior.
| Metric | What It Measures |
|---|---|
| MFE | Greatest movement in the trader’s favor |
| MAE | Greatest movement against the trader’s position |
Together, MFE and MAE can provide a more complete picture of how a strategy behaves while trades are open.
MFE May Help Traders Evaluate
- Profit targets
- Exit efficiency
- Trailing-stop strategies
- Profit-taking behavior
MAE May Help Traders Analyze
- Stop-loss placement
- Entry quality
- Drawdown within individual trades
- Risk management
Reviewing both metrics can provide considerably more information than simply categorizing each position as a winner or loser.
Final Thoughts on Maximum Favorable Excursion
Maximum Favorable Excursion is a powerful trading-performance metric because it shows what happened inside a trade, not simply how the trade ended.
By tracking the greatest favorable movement achieved by each position, traders can study whether they are:
- Consistently exiting profitable trades too early
- Allowing excessive unrealized profits to disappear
- Using take-profit targets that are too ambitious
- Managing trades inconsistently
- Following exit rules that do not match the historical behavior of their strategy
However, MFE should not be used to predict exactly where the next market move will end.
Its greatest value comes from analyzing large samples of historical trades, identifying recurring patterns, and using those patterns to make informed adjustments to a trading plan.
Good trading decisions are rarely built around a single position.
They are developed through:
Data. Consistency. Risk management. Continuous evaluation.
Trade smart with DAK Markets.
This material is provided for educational purposes only and does not constitute investment advice. Trading leveraged financial products involves significant risk and may not be suitable for all investors.